Fast coverage analysis for binary applications
Despite its simplicity, fuzzing has become a more and more popular technique for finding software bugs (and possibly security vulnerabilities), especially when dealing with complex or closed-source applications. The recipe for a basic fuzzer is well-known: pick your favorite target application and run it on “weird” inputs. Hopefully, one of these inputs will trigger some corner-case behaviors, which produce externally-observable side effects, such as a program crash.
The main drawback of this approach is that, at least in its naive form, it can trigger only very shallow program paths: it may take a humongous number of inputs to reach even slightly convoluted branches. For example, consider a statement such that “if (a == 31337) then {...}”; to reach the “then” block using a completely blind approach, the fuzzer would need to guess the correct value for variable “a” out of 2**32 distinct possibilities (considering 32-bit integers). To address this limitation, “smarter” testing approaches have been proposed. Among these, symbolic and concolic execution techniques have recently become quite popular among security researchers, but their applications to real-world products are still questionable, especially because of the complexity explosion when dealing with the intricacies of real-world software. Thus, simple fuzzing is still widely used, and many researchers strive to find ways to make it more effective while, at the same time, trying to keep its overhead as close as possible to that of a native black-box approach.
Following this trend, recently, @lcamtuf has demonstrated that simple fuzz testing can still identify dangerous bugs: his “american fuzzy lop” (afl) approach consists in running the target program over a carefully selected set of test cases, while observing it via compile-time instrumentation that permits to monitor instruction-level coverage. In a nutshell, test cases that reach novel instructions are “more interesting”, as they could also trigger different program behaviors.
We were recently talking about the applicability of the afl approach to binary applications as well. The first problem concerns the monitoring phase: how to calculate the coverage for a given input? Obviously, as the target application is binary-only, source-level instrumentation is not an option.
Coverage analysis of binary applications
Strictly speaking, for the sake of tracking the progress of our fuzzing process, instead of instruction coverage, an analysis at the basic-block level should suffice: as basic blocks are uninterruptible single-entry, single-exit sequences of instructions, the two should be roughly equivalent (at least if we ignore asynchronous events).
As an example, the following x86 assembly snippet encodes a simple loop.
B1:
    xor %ecx, %ecx

B2:
    inc %ecx
    cmp $0x3, %ecx
    jb B2

B3:
    ...
When monitoring the execution of this code, we would like to produce the basic blocks trace <B1, B2, B2, B2, B3>.
Monitoring via binary instrumentation
The problem of monitoring binary applications for coverage analysis was recently discussed also by some researchers (e.g., see @matalaz presentation here) who suggested to rely on binary instrumentation, e.g., using Pin, DynamoRIO, or Valgrind. More recently, other researchers started to implement similar approaches in order to port “afl” to closed-source applications, both relying on PIN or QEMU (the latter has also been integrated into “afl” since version 1.31b).
But what about performances? One of the main strengths of random fuzzing approaches is their high execution rate, as fuzzed inputs are executed nearly at native speed. But if the monitoring phase costs too much, the whole process is slowed down significantly.
As an example, consider this minimal Pin tool that inserts a callback function before the execution of every program basic block (well, actually at every Pin “trace”, i.e., a single-entry sequence of basic blocks, but we can ignore the differences here). Obviously this trivial tool cannot be considered as a real process monitor, but can certainly be used to estimate a lower bound for the performances of this approach.
#include "pin.H"

VOID CallbackTrace(TRACE trace, VOID *v) {
   // Insert callback instructions here
}

int main(int argc, char **argv) {
  PIN_Init(argc, argv);
  TRACE_AddInstrumentFunction(CallbackTrace, 0);
  PIN_StartProgram();
  return 0;
}
Even such a trivial Pin tool introduces a significant overhead. As an example, running it over /bin/ls takes about 340ms on a normal laptop, a 100x overhead with respect to a native execution. Pin experts can certainly further reduce the performance penalty with some tweaks, but the order of magnitude should not change very much: after all, dynamic binary translation tools have to decode, translate, instrument, and finally recompile target code before executing it.
Introducing Intel BTS
Modern processors include sophisticated debug and performance monitoring facilities. Intel introduced these features in early Pentium processors and continued to extend them in subsequent CPU models (see chapters 17 and 18 of Intel manuals for details).
Among these facilities, Intel BTS (“Branch Trace Store”) permits to record a trace of executed branch instructions to a memory buffer. In a nutshell, BTS records executed control-flow edges, as (source, destination) pairs. This mechanism is quite customizable, and can be configured to generate an interrupt when the BTS buffer is almost full, monitor only a specified privilege level (e.g., to track only user-space branches), or limit the capture to selected branch types (e.g., indirect/conditional branches, returns, calls). These characteristics make BTS an attractive approach for performing branch-level coverage analysis of a binary application.
BTS is configured by writing settings to dedicated MSR registers (again, see Intel manuals for low-level details). These operations should be carried out by kernel-level code, thus specific OS modules are required to permit the implementation of user-space monitor applications. Fortunately, Intel BTS is already supported by latest versions of the Linux performance monitoring subsystem, and is exposed to user-space via the perf_event_open() system call (for a user-space client see also the perf tool).
Coverage analysis using Intel BTS
Despite Linux performance monitoring is documented quite well, details about how to use perf_event_open() specifically for controlling BTS are scarce, except for few public examples: it is quite easy to invoke the API with improper parameters that force the subsystem to “fall-back” on software-based performance monitoring, with significant performance penalties. Thus, during our experiments we developed a coverage analysis tool that leverages this API to perform hardware-assisted tracing of the basic blocks executed by a target application. Information about executed basic blocks is dumped to a Google protobuf file, for easy post-processing. As an example, the following excerpt show the tracing of /bin/ls and the dump in human-readable form of the resulting protobuf file:
$ ./bts_trace -f /dev/shm/ls.trace -- /bin/ls >/dev/null
[*] Got 50758 events (2486 CFG edges), serializing to /dev/shm/ls.trace

$ python trace.py /dev/shm/ls.trace
#### Trace '/dev/shm/ls.trace' ####
[/dev/shm/ls.trace] cmd: test, data: 0 bytes, time: 2015-01-29 19:21:58
hash: 2dc92a, edges(s): 2486, exception(s): 0

 - CFG edges
 [00402176 -> 0040217d] 1 hit
 [00402181 -> 00412513] 1 hit
 [00402196 -> 7f1d372dc2f0] 28 hit
 [004021c0 -> 004021c6] 1 hit
 [004021c0 -> 7f1d36b281b0] 7 hit
 [004021cb -> 00402190] 1 hit
 ...
 [7f1d372e0ac7 -> 7f1d372e0a30] 2 hit
 [7f1d372e0af7 -> 7f1d372e0a20] 2 hit
 [7f1d372e0b1b -> 7f1d372e0635] 4 hit

 - Memory regions
 [0x00400000, 0x0041bfff] /bin/ls
 [0x7f1d3625d000, 0x7f1d36479fff] /lib/x86_64-linux-gnu/libpthread-2.19.so
 [0x7f1d3647a000, 0x7f1d3667efff] /lib/x86_64-linux-gnu/libattr.so.1.1.0
 ...
Running our tool over /bin/ls takes about 90ms, about 1/4 of the time required by the Pin-based tracer we sketched above. Consider also that this includes the time spent for the creation & serialization of the protobuf stream to file, while none of these operations are performed by the Pin-based tracer: the latter introduces a very high overhead with just the instrumentation required to trace BBs, without auxiliary functions for storing and eventually serializing the execution trace.
Both the BTS tracer and the trace viewer are available here, so feel free to give them a try! The current implementation is quite rough, so we believe there is still room for improvement.
Construction of the basic block “hit map”
Starting from the generated trace file, it is also possible to build the control-flow graph (CFG). Clearly, using this approach we can build a dynamic CFG only, i.e., a graph that includes control-flow edges observed in the concrete execution, but multiple execution traces could be also merged together to better approximate the static CFG. In addition, the information about how many times each basic block has been executed (i.e., the number of “hits”) could also be used to generate a “hit map” of basic blocks frequencies, possibly to guide the fuzz testing phase.
As an example, consider the following C implementation of a classical binary search algorithm.
static int bisect(int v[], int size, int key) {
  int start, end, middle, pos;

  start = 0;
  end = size-1;
  pos = -1;
  while (start <= end) {
	middle = (end+start)/2;
	if (v[middle] > key) {
		end = middle-1;
	} else if (v[middle] < key) {
		start = middle+1;
	} else {
		pos = middle;
		break;
	}
  }

  return pos;
}
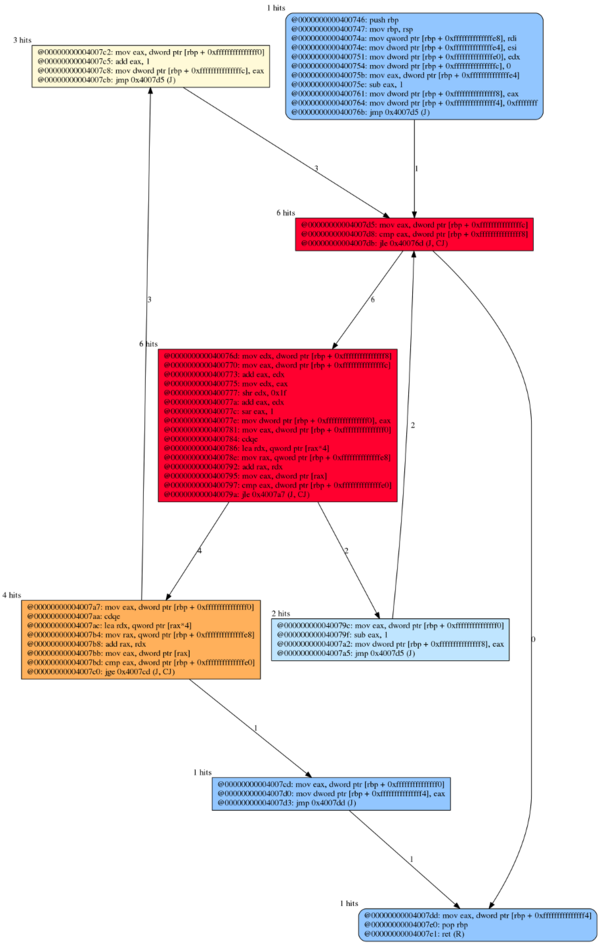
The left CFG in the following figure is a “hit map” for a monitored execution of bisect(), on a sorted array of 1024 elements. Despite we previously shown the C source for this method, the CFG has been constructed dynamically from the binary code. Colors reflect the number of node hits, i.e., how many times the node has been executed in the observed execution. Nodes and edges labels indicate the actual hits. It is finally worth noting that for conditional branches, whenever possible, we also add to the graph those edges that have not been taken during the observed execution; this is done just to better approximate the static CFG of the application, but is technically not required to support a subsequent fuzzing phase.
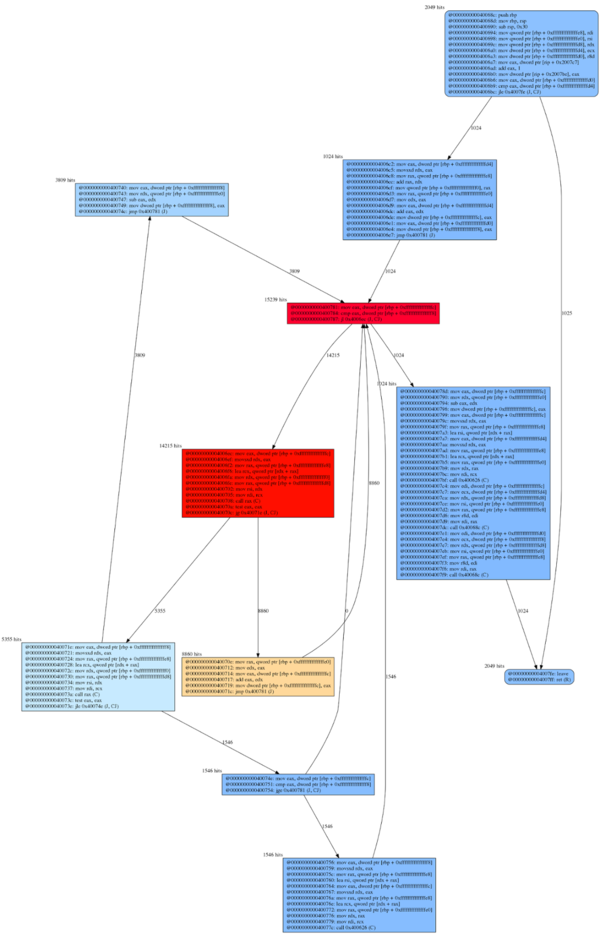
To conclude, the right part of the figure shows another example of a “hit map”, this time for an execution of a recursive quicksort algorithm, running on a random array of 1024 integers (C code for this test case is available here).


Conclusions
Hardware-assisted performance monitoring could be an interesting approach to implement efficient coverage analysis tools, which in turn can be employed to support fuzz testing and other security-related applications. At this aim, we developed a sample tool that leverages the Intel “Branch Trace Store” facility. Our current implementation is just a little more than a proof-of-concept. Currently, its major limitation is that, in some situations, we lose some branch events. This may happen when the branch rate is very high, such as when the monitored application enters a tight loop. We are still investigating these issues, and we hope some interested reader could also contribute with some patches ;-)